Fluid Flow Tutorial
Karl Sims
This tutorial illustrates a simple technique for simulating 2D
incompressible fluids for visual effects. We'll skip the usual
discussion of the classic Navier-Stokes equations, and instead focus
on a specific implementation, much of which is derived from
Jos Stam's Stable Fluids method.
|
|
 |
|
|
Flow field
A flow field is represented by a grid of velocity vectors. The
example on the right shows rotational vortex motions about two centers.
Visualization
A flow field can be visualized by advecting tracer particles or
textures through it. Particles can be "pushed" through a flow field
by reading the flow velocities to move their positions, but images are
"pulled" by warping them in the local direction of flow. For the
examples below, animation cycles were made by repeatedly inserting
lines of particles or stamping a checker pattern in the tracer image
over time.
|
|

|
|

Particles are pushed: each particle's position is updated by
the flow velocity at the particle's current position,
interpolating between flow vectors as appropriate.
|
|

Textures are pulled: a tracer image is repeatedly warped by reading color
values from upstream pixels in the negative direction of flow. The
image is typically at higher resolution than the flow field.
|
|
Fluid momentum
The visualizations above show tracers moving through a static flow
field, but the flow itself can also dynamically change over
time.
To simulate fluid momentum, the flow field can simply flow itself.
Flow vectors are updated by reading interpolated values from
upstream grid cells in the same way the tracer image is advected above.
New vector values are pulled from the negative direction of flow.
Momentum on its own causes circular flows to expand away from their
centers which would create lower pressure areas analogous to those
occurring at the center of hurricanes or tornadoes. To properly
simulate incompressible fluids, we next need to even out the pressure
differences caused by diverging and converging flow.
|
|

A flow field warps itself by reading from upstream values.
|
Divergence
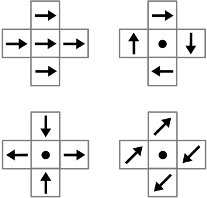
Divergence is a measure of the local expansion in a vector field, and
is calculated at a given point by summing the outward components of
neighboring vectors. Negative divergence corresponds to contraction.
Translation, rotation, and shearing motions have zero divergence
because their inward and outward components are balanced.
|
Positive divergence |
|
Negative divergence |
|
Zero divergence |
|
|
 |
|
 |
|
 |
|
| The divergence at the center of a given cell can be
found by summing the x component of the vector to its right, minus the
x of the vector to its left, plus the y of the
vector above, minus the y of the vector below: |
|
Similarly a divergence value at the corner
between cells can be found by summing the dot products of the adjacent cell
vectors with the outward diagonal vectors: |
|
 |
|
 |
Removing divergence
To enforce incompressibility and remove changes in pressure, we
attempt to zero out the divergence throughout the flow field. This is
done by adding flow away from high pressure converging areas, and
toward low pressure diverging areas. A gradient is the slope or rate
of change of a value across a grid. The gradient of the divergence
is a vector field that points from high pressure to low pressure
areas. So to remove the divergence from a flow field, we repeatedly
increment it by the gradient of its divergence.
We can combine the divergence and gradient calculations, and if we
find divergence values at the corners between grid cells instead of at
their centers, we can use a simple 3x3 convolution for this. The left
image below represents four local divergences in different colors.
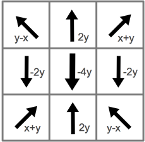
Each divergence value is the sum of the outward diagonal vector
components of the 4 adjacent cells. The horizontal (x) gradient at
the center cell is found by the two right divergence values minus the
two left (green + blue - red - orange). The vertical (y) gradient is
found by the two top minus the two bottom (red + green - orange -
blue).
|
Divergence at 4 corners |
|
Divergence x gradient |
|
Divergence y gradient |
|
|
 |
|
 |
|
 |
The divergence x and y gradients are shown above as 3x3 grids of
vectors, and the neighboring flow vectors in those directions (dot
products) can be summed for that gradient component of the center
cell. For stability, the gradient is scaled by 1/8 before adding it
to the flow field. Combining these x and y gradients using vector
operations, the kernel code to update each flow-field vector might look
something like this:
f'[x,y] = f[x,y] + (dot(f[x-1,y-1] + f[x+1,y+1], {1,1}) +
                    dot(f[x-1,y+1] + f[x+1,y-1], {1,-1}) * {1,-1} +
                    (f[x-1,y] + f[x+1,y] - f[x,y-1] - f[x,y+1]) * {2,-2} +
                    f[x,y] * -4) * 1/8
where f[x,y] is the vector at location x,y
of the flow field, f' is the updated flow field,
and {i,j} are constant vectors. This step is performed many
times to spread the incompressibility across the flow field, perhaps
50 iterations per frame or more depending on the resolution and fluid
behavior.
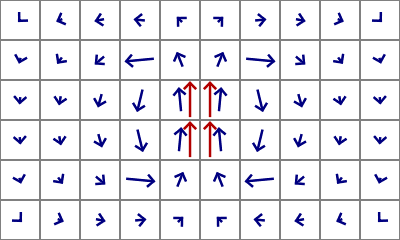
The images below show an initial vector field in red with non-zero
divergence, and the results in blue after divergence removal. On the
left, the outward momentum forces from a rotation are cancelled giving
more stable swirls. On the right, the effect of an external pulse at
the center is spread throughout the grid and starts to generate a pair
of vortices like a canoe paddle in water.
|
 |
|
 |
|
|
Removing divergence from the red vector field prevents swirls from spreading outward.
|
|
Removing divergence from an external pulse propagates it into a vortex pair.
|
Boundary conditions
To find divergence values at the cells on the edge of the grid, we
need to generate flow vectors from just outside the grid. Different
methods for this can give different edge behaviors:
-
Zero: using a value of zero beyond the grid will avoid flow
toward or away from the boundary, as if the fluid is contained in a
box, because any edge cell's component of flow normal to the boundary
would typically create a non-zero divergence and be removed. The
divergence-removal examples above used this mode.
-
Repeat: repeating the flow value from the nearest edge cell
will instead allow flow toward or away from the edges as if the fluid
can exit or enter the grid.
-
Scaled repeat: combining zero and repeat edge-modes can also be
useful. Using a scaled value of the nearest edge cell can give a soft
boundary effect that slows down the flow at the edges but doesn't
completely stop it. Alternatively, using zero for the flow component
normal to the boundary, and repeat mode for the component parallel to
the boundary, can give a more slippery edge effect.
-
Wrap: copying the flow value from the opposite side of the
grid can create a wrap-around behavior where flow exiting on one side
of the grid enters on the other.
Obstacles can also be added to the grid with similar boundary
conditions by forcing the flow, or its normal component, to zero at
their locations.
External forces
Realistic looking fluid behavior can be generated by alternating
between the fluid momentum and divergence-removal steps described
above. However some non-zero flow velocity needs to be set somehow,
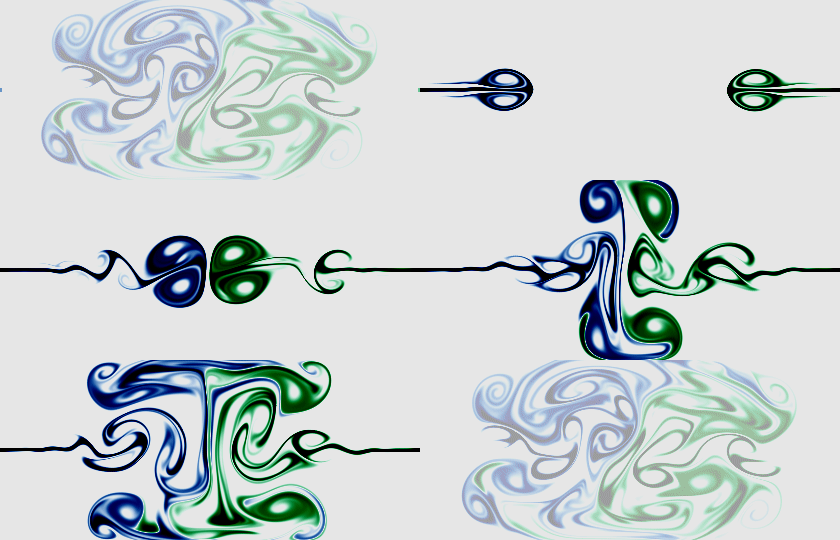
either procedurally or interactively. For example, adding linear flow
at specific locations can create a squirting ink effect (see below),
or tracking mouse or camera motion can be used to interactively push
the fluid.
Other forces can be added to simulate various physical phenomena:
-
Gravity or buoyency can affect some parts of the fluid
differently than others using a tracer image that represents the fluid
density.
-
Damping or friction can reduce the flow velocity over time.
-
Viscosity can be simulated by diffusing the flow field slightly
at each time step so the velocities become more like their neighbors.
Note that the repeated resampling of the flow field will also cause a
small amount of diffusion.
-
Cohesive forces can be approximated by using a tracer image to
track different fluid substances, such as oil vs water, and then
pushing the substances toward areas of the same type, moving convex
boundaries inwards and concave boundaries outwards.
|
Summary of procedure
For each fluid simulation time step:
- Advect flow for momentum
- Add external forces
- Remove divergence (multiple iterations)
- Update tracers for visualization
|
|
 |
Multi-grid efficiency
The divergence removal process can be sped up significantly using
multiple grid resolutions. We can average the flow field down to
half-res and remove the divergence from that, then add the difference
between the processed and original half-res grid back to the full-res
grid, and finally perform a few divergence-removal iterations at
full-res. This can be done recursively so most of the work is done at
1/4 or even lower resolution, which easily allows for real-time
results when implemented on a modern GPU.
Accuracy
This method is meant to create useful visual results rather than
accurately model physics, but here are a few tips that might reduce
unwanted artifacts. For fast moving fluid, use multiple fluid
simulation time steps per frame. Use higher resolution for tracer
images than for the flow-field grid. Use smooth bicubic interpolation if
possible when reading from tracer images and flow fields. For
repeated warping of tracer images that aren't being modified in other
ways, temporarily warp their coordinates instead, and then resample
after multiple iterations.
3D
These methods are extendable to 3D, using volume data for flow fields
and tracer images, and 3x3x3 convolutions for divergence removal, but
of course it may be more difficult to generate 3D results in
real-time, depending on your hardware and volume dimensions.
References
Jos
Stam, "Stable Fluids", SIGGRAPH 1999 Conference Proceedings
Navier-Stokes equations
Visit Flow, an interactive exhibit
that employs these techniques.
Back to other work by Karl Sims
© 2018, Karl Sims, All rights reserved.


